CASSIOPE SPACECRAFT (Swarm-E)
PROCESSED DATA HANDBOOK
SEI Summary Plot
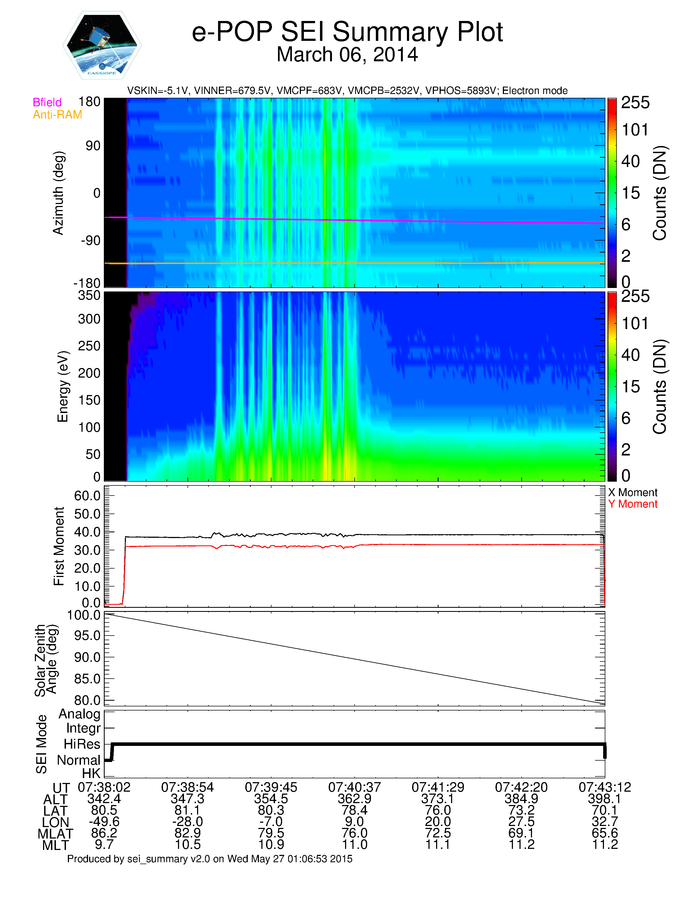
An SEI Summary Plot file is generated for each SEI turn on session. It contains 5 plots plotted with respect to Universal Time, geographic latitude (degrees), geographic longitude (degrees), altitude (km), magnetic latitude (degrees), and magnetic local time (hours) for the period that the SEI instrument was on. The first and second plots are the digital number counts plotted along Azimuth(deg) and Energy(eV) respectively. The third plot shows the X and Y first moments (mean deviation frequency distribution). The fourth plot is the Solar Zenith Angle (deg) with respect to CASSIOPE’s global position. The fifth plot describes the mode SEI is currently operating in.