
CASSIOPE SPACECRAFT (Swarm-E)
PROCESSED DATA HANDBOOK
IRM Summary Plot
An IRM Summary PNG file is generated for each IRM turn-on session.
Summary plots are a one-page time-series plot of pixel counts, time-of-arrival bin, skin current, and total counts per second. A sample is shown in the figure below.
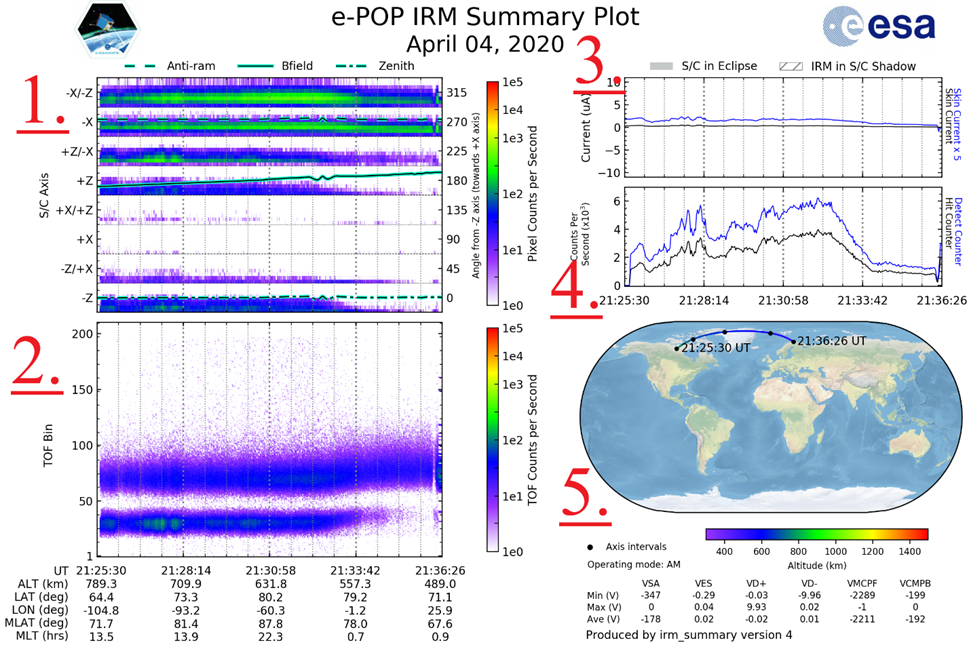
[Annotated 1] This plot is made up of 8 rows, representing the spacecraft axes in the X-Z plane, which correspond to the 8 ‘arms’ (pixel columns) of the IRM detector anode. For visualization, the anode is pictured on the IRM Quicklook page. The pixel count rate in each pixel column is then plotted as a function of time. The y-axis labels indicate which pixel column is represented, and within each pixel column the counts on each pixel row are plotted from bottom to top. For instance, in the –X row the pixel count rate for the inner most pixels on the anode arm is at the bottom of the row, and the count rate for outer most pixels is plotted at the top of the –X row. This is repeated for each row in this panel. Note that the colour-coded counts are shown in a ‘compressed log scale’ where the top two decades are compressed compared to the bottom three. The attitude of the spacecraft is shown by the solid, dotted, and dash-dot lines overlaid on the plot, representing the direction of the magnetic field, anti-ram, and zenith directions, respectively, when projected onto the IRM anode plane.
[Annotated 2] is a time series spectrogram of the time-of-arrival bin counts. In this example it is clear that there are at least two species present filling up two distinct time-of-arrival bin ranges. Note that the colours are also plotted in the compressed log scale.
[Annotated 3] shows the current on the IRM outer skin in microamps (positive indicating a net positive charge flux on the sensor surface).
[Annotated 4] plots the ‘hit counter’ and ‘detect counter’ values. The ‘hit counter’ is incremented when two adjacent amplifiers on the IRM anode register a count whereas the ‘detect counter’ is incremented when only one amplifier records a count. These two values together give an indication of the spread of the electron cloud produced by the microchannel plates that make up part of the IRM ion detection assembly. The pixel counts in [Annotated 1] are made up of ‘hit counter’ counts.
[Annotated 5] The spacecraft position is shown on the map, color-coded by altitude, with the start and end times of the IRM operation session marked. IRM operating voltages and settings are shown in the table below the map. Refer to reference R5 for a description of the voltages and operating modes of IRM.