CASSIOPE SPACECRAFT (Swarm-E)
PROCESSED DATA HANDBOOK
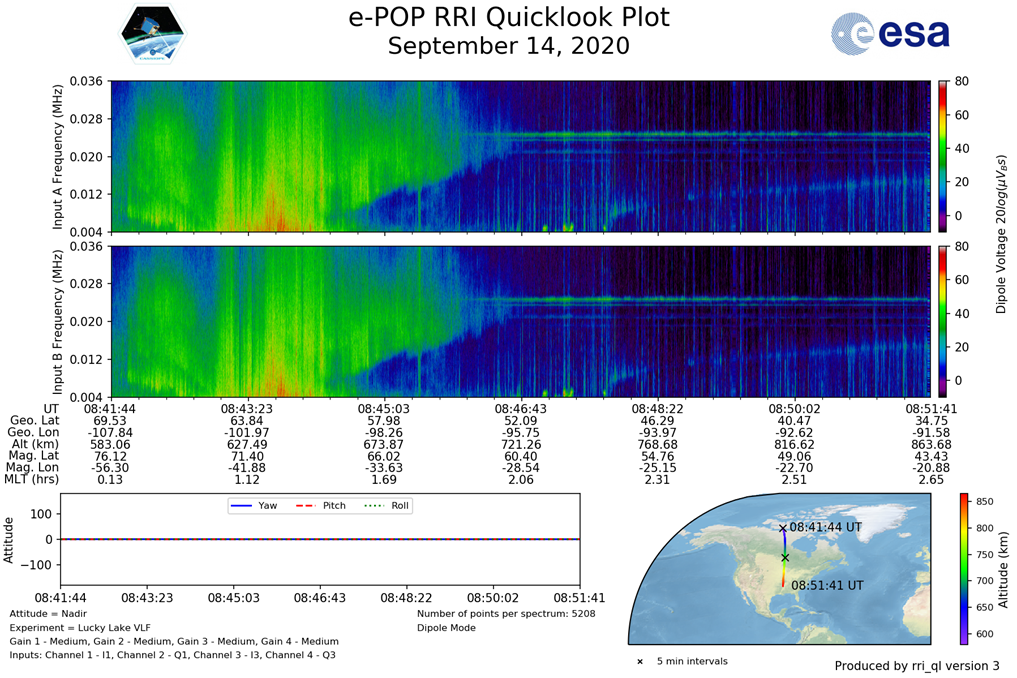
RRI Quick Look Plot
An RRI QL PNG file is generated for each RRI turn-on session.
The RRI QL gives an overview of the voltage recorded by the RRI antenna dipoles, labeled as Input A and Input B, as a function of time in a spectrogram format. RRI’s settings and the number of RRI data samples used in each Fourier transform to produce the spectrogram is listed in the bottom left, below the attitude graph. The power (in dB) seen by each dipole is colour coded; the colour scale is shown to the right of each spectrogram.
On the vertical axis of each spectrogram is the input frequency for Dipoles A/B in MHz. The plotted frequency range of the spectrogram is 36 kHz, the approximate width of RRI’s passband. Universal Time and the CASSIOPE ephemeris (geographic latitude (degrees), geographic longitude (degrees), altitude (km), magnetic latitude (degrees), magnetic longitude (degrees), and magnetic local time (hours)) is plotted along the horizontal axis.
Bottom left of the spectrogram is a plot of the spacecraft attitude in degrees (180 to -180) of yaw, pitch and roll (see Coordinate Systems). Bottom right of the panel is a plot of CASSIOPE’s path for this pass, color-coded by altitude.