
CASSIOPE SPACECRAFT (Swarm-E)
PROCESSED DATA HANDBOOK
IRM Quick Look Plot
An IRM Quicklook (QL) PNG file is generated for each IRM turn-on session.
IRM QL videos, produced from IRM level 0 data, give an indication of instrument health, settings, and quality of data captured by the instrument. Figure 2 shows a snapshot from an IRM QL video.
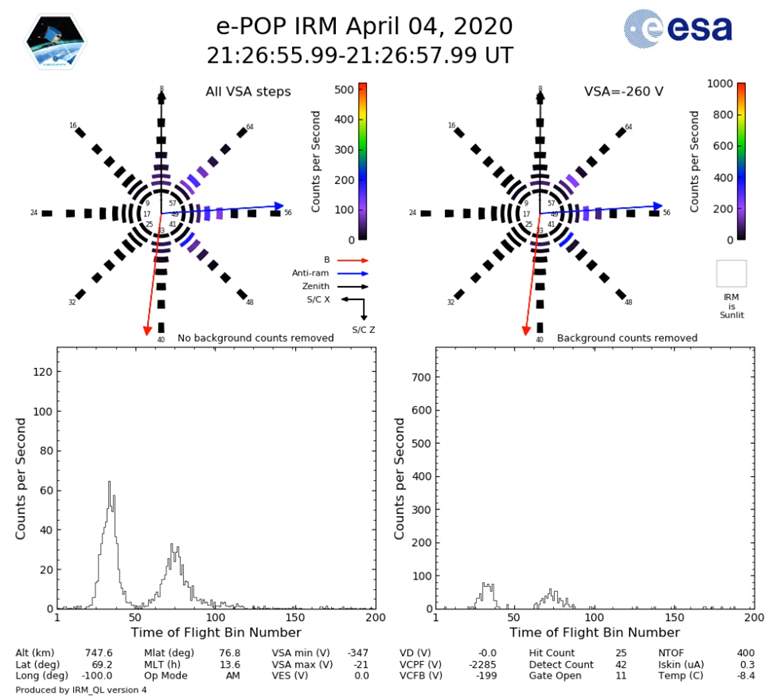
The top left pane shows the IRM detector pixel layout and associated count rate for each pixel including counts from all inner dome voltage settings for the time period indicated in the title area. The magnetic field, anti-ram, and zenith directions, projected into the plane of the sensor, are overlaid as red, blue, and black arrows, respectively.
The bottom pane is a plot of the count rate for each time-of-arrival bin for all inner dome voltage settings combined. The two left panes do not correct for background counts. Background counts are those ions which pass through the time-of-flight gate when it is closed. These ions can be accounted for by estimating their count rate in each pixel/time-of-arrival bin by analyzing the counts in the upper time-of-arrival bins where no ion counts should be detected.
The right upper and lower plots are the same as the left but include counts for a single VSA step only at -260 V, with the estimated background counts removed.
The bottom of the QL shows the operating parameters and spacecraft location. Descriptions of the operating parameters can be found in reference R5.