CASSIOPE SPACECRAFT (Swarm-E)
PROCESSED DATA HANDBOOK
FAI Summary Plot
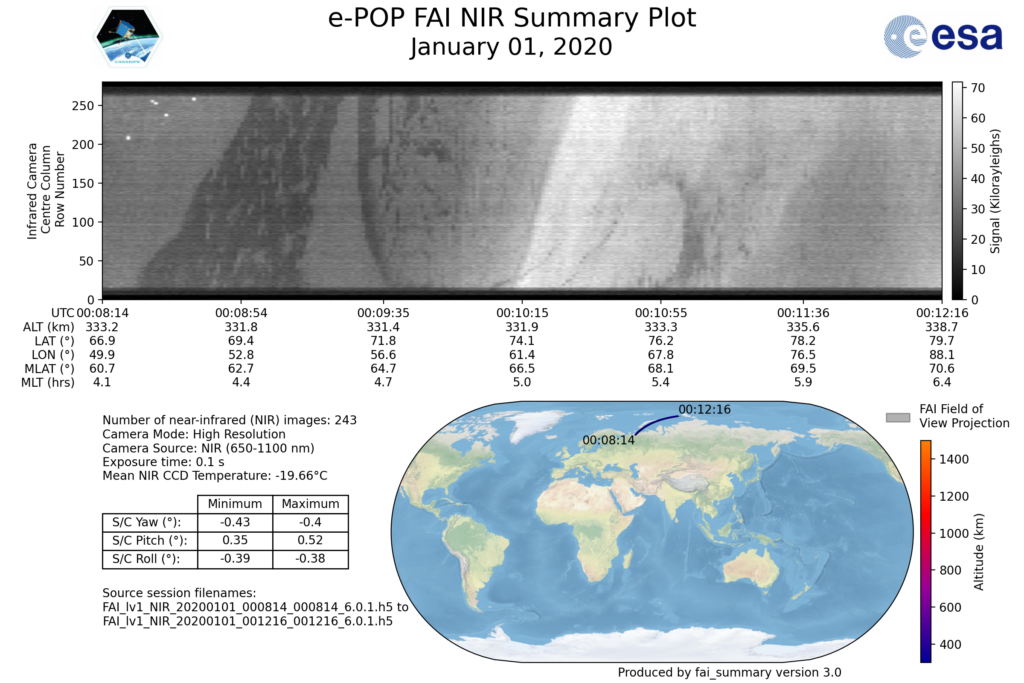
An FAI Summary plot is generated for each FAI camera turn-on session. The FAI Summary plot contains three sections.
The top section is a keogram generated from the camera images. It is with respect to Universal Time and CASSIOPE ephemeris along the horizontal axis: geographic altitude (km), geographic latitude (degrees), geographic longitude (degrees), magnetic latitude (degrees), and magnetic local time (hours).
The bottom left section contains attributes about the pass. These are: the number of images taken, the camera mode (high resolution(256×280), medium resolution(128×140) or low resolution (64×70)), the camera source (NIR (650-1100 nm), or Visible (630 nm)), the exposure time (s), and the average camera CCD temperature (degrees Celsius). This section also includes the minimum and maximum spacecraft yaw, pitch, and roll.
The bottom right section shows a map of CASSIOPE’s geophysical location, start and end positions, and a shaded area of the FAI field of view during the pass.