CASSIOPE SPACECRAFT (Swarm-E)
PROCESSED DATA HANDBOOK
CERTO Total Electron Content (TEC) Data Files
CERTO does not generate any data on the spacecraft, rather all data is generated on the ground at the receiving station and uploaded to the CASSIOPE data servers. For each CERTO turn on session a set of CERTO TEC data products are generated.
Four data files are created for each CERTO pass over a receiving ground station. The files have the following filename formats: <timetag>.its, <timetag>.mag, <timetag>.pro, and <timetag>.snt. The four files each contain a header that includes the first time point (subsequent time data points are relative to this value) and a two-line-element set for CASSIOPE.
- <timetag>.its is the raw data file.
- <timetag>.pro is the main processed data file, containing the Total Electron Count computed for each second (which is a weighted average of 50 data points), the azimuth and elevation of the satellite as viewed from the station, and the geocentric latitude and longitude of the F-layer and E-layer penetration points of the line between the satellite and the station. There are also three data quality flags. Below that data set is another data set of the UHF S4, VHF S4 and RMS Phase computed over 10 seconds.
- <timetag>.mag is a diagnostic file. It is only used to evaluate receiver performance. Like the main processed data file, it contains the Total Electron Count computed for each second (which is a weighted average of 50 data points), the azimuth and elevation of the satellite as viewed from the station, and the data quality flags. Instead of the penetration points, the last columns of data contain the signal strengths for VHF and UHF (in counts), and the computed Signal-to-Noise ratio. Below the main header and above the column headers are five lines of diagnostic data:
- Noise Intensity (from the last five seconds of raw data after lock has been lost);
- I channel average during the last five seconds
- Q channel average during the last five seconds
- Peak Signal-to-Noise (averaged over 60 seconds)
- Peak signal intensity (averaged over 60 seconds)
- <timetag>.snt is a plotting file for plotting scintillation data. It is computed for each data point. It contains the detrended intensities of UHF and VHF, and the relative phase between them. If the data quality falls below certain thresholds, the values are set to -999.999.
Summary Table:
| File | Contents |
| <timetag>.its | VHF (I) (150Mhz) |
| VHF (Q) (150Mhz) | |
| UHF (I) (400Mhz) | |
| UHF (Q) (400Mhz) | |
| L-B (I) (1067MHz) | |
| L-B (Q) (1067MHz) | |
| 7th column | |
| <timetag>.pro | Time (s) relative to first datapoint |
| Relative total electron content | |
| Azimuth (°) | |
| Elevation (°) | |
| F-region peak latitude (°) | |
| F-region peak longitude (°) | |
| E-region peak latitude (°) | |
| E-region peak longitude (°) | |
| <timetag>.snt | UHF relative amplitude (dB) |
| VHF relative amplitude (dB) | |
| Phase residual (rad) | |
| <timetag>.mag | Time (s) relative to first datapoint |
| Relative TEC (10^16) | |
| Azimuth (°) | |
| Elevation (°) | |
| UHF rms-amp (count per second) | |
| VHF rms-amp (count per second) | |
| UHF SPNR (dB) | |
| VHF SPNR (dB) |
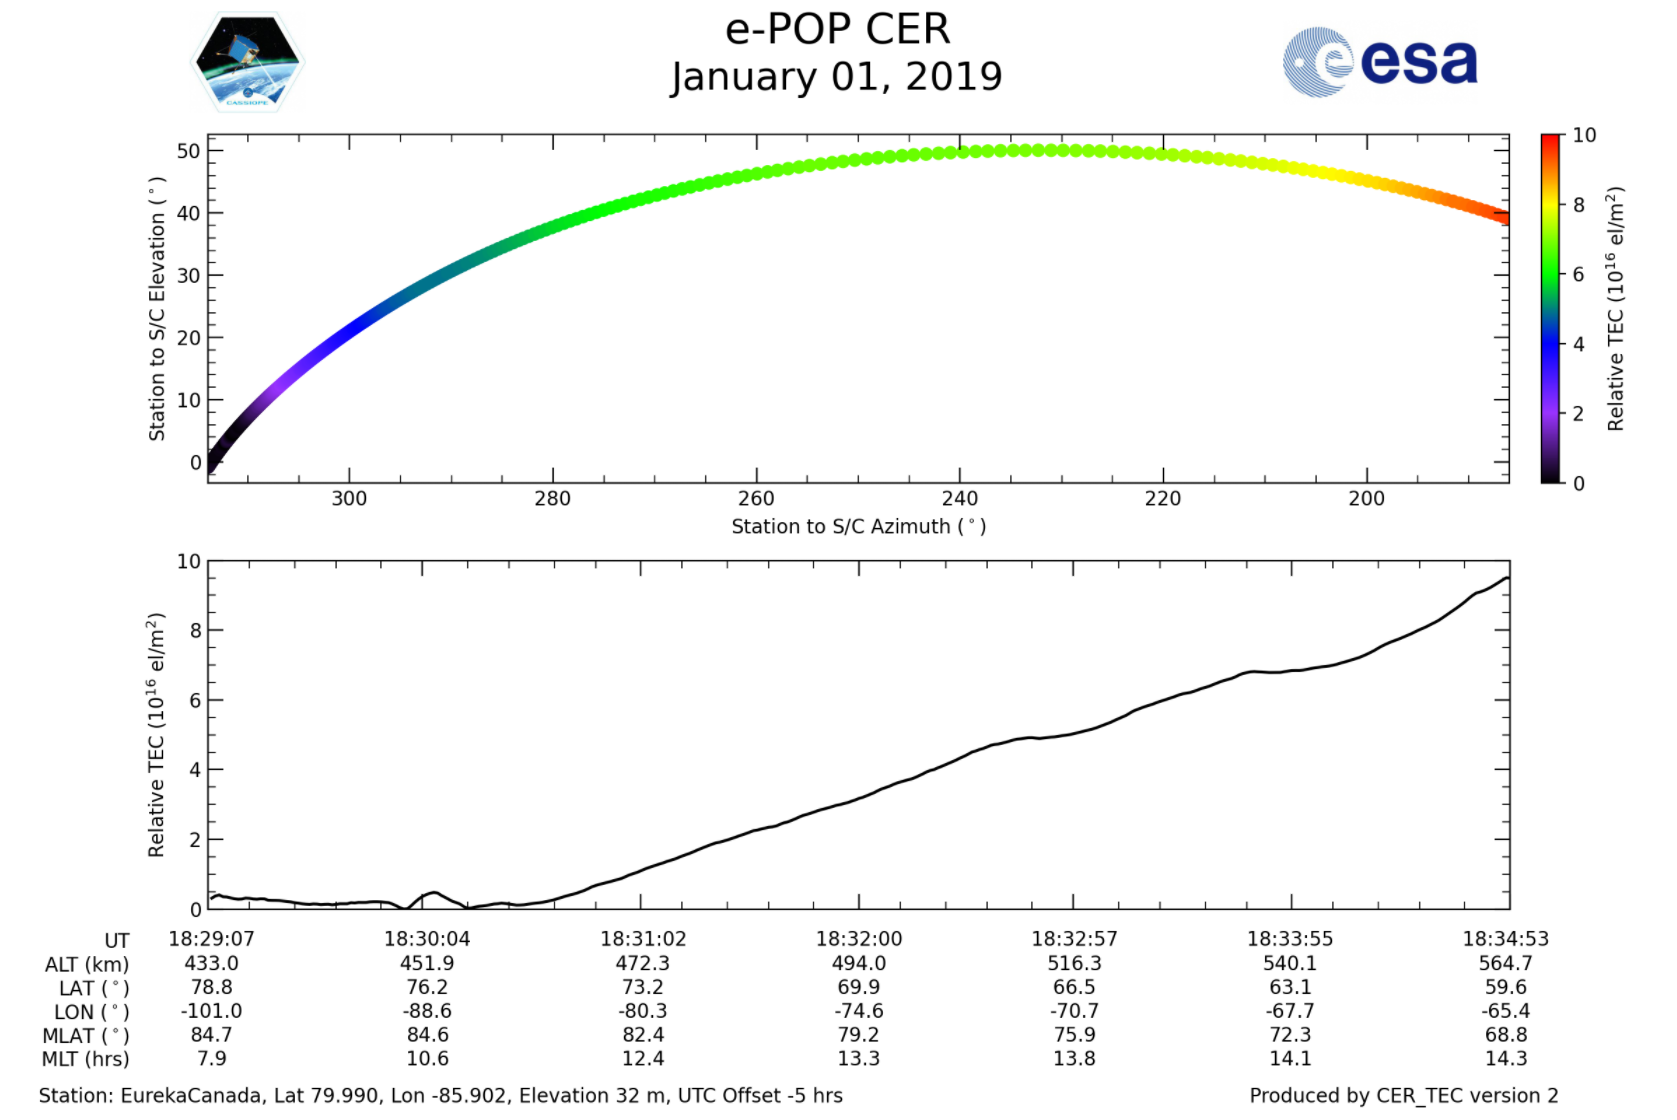
Once data is received from the CERTO ground stations, a TEC data plot is produced. In the first panel the spacecraft elevation angle versus the azimuth angle is plotted. The color of the line indicates the relative TEC value. The second panel is a plot of the TEC versus time (UTC). Also included along the X axis is CASSIOPE’s ephemeris which includes geographic latitude (degrees), geographic longitude (degrees), altitude (km), magnetic latitude (degrees), and magnetic local time (hours)).