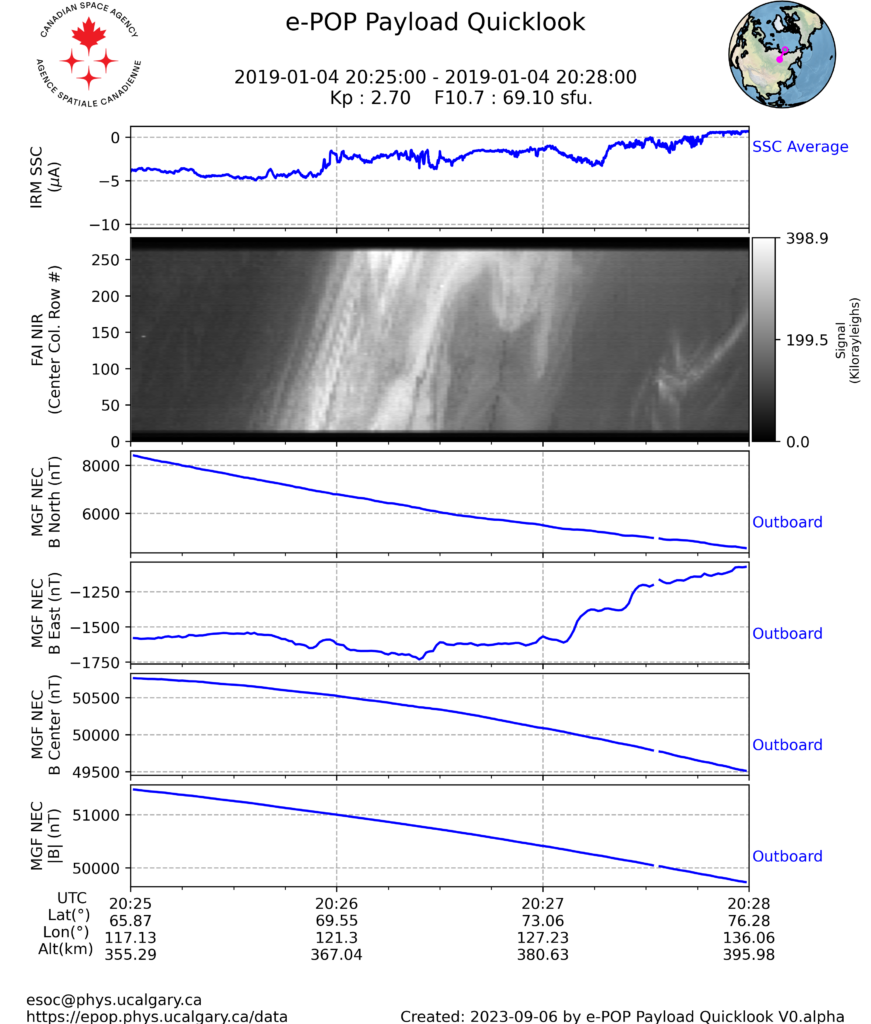
We are pleased to announce that, through support of the Canadian Space Agency, a new web tool is now available for creation of stacked quicklook plots of e-POP data. With this new tool, users can quickly and easily create plots of e-POP data, choosing from over 20 different data sets including FAI images, MGF magnetic fields, IRM surface current, S/C temperatures and wheel speeds, and more.
This tool makes inspection of e-POP data simple and fast, allowing for event discovery to proceed without the burden of manually importing the many data sets from CASSIOPE/e-POP . Users can select the data they need to see with the click of a button and export the resulting image with any quality desired – no more pixelated quicklook images!
To test out the functionality, head over to the e-POP Payload Quicklook webpage.

