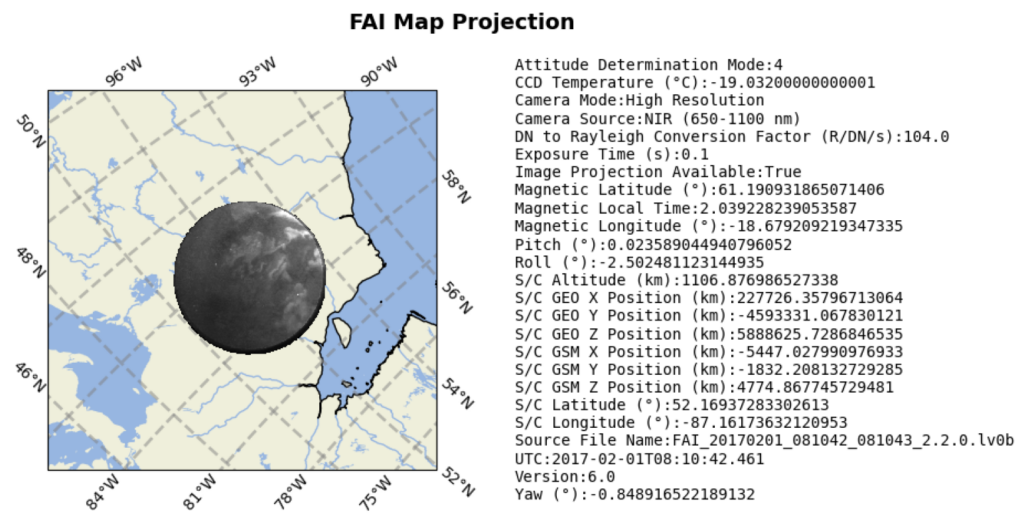
We are pleased to announce the release of the e-POP Data Tutorials – a set of Python Jupyter Notebooks and PDF files that walk users through how to read, plot, and work with the various e-POP data sets. Examples include tutorials on reading, displaying, and mapping FAI images, a notebook for reading and plotting the IRM sensor surface current, as well as a tutorial on obtaining and plotting the CASSIOPE ephemeris and attitude data. More tutorials will be made available as they are generated.
Questions and comments are welcome, please don’t hesitate to reach out to esoc@phys.ucalgary.ca.